New Deal Checklist: Fix vs Float
In our New Deal Checklist, we've talked about the term mismatch premium and prepayment penalties. Now in Pt 3, let's dig into fixed rates versus floating rates. Is one rate type better than the other?
In case you missed our first two blogs (Term Mismatch and What's It's Costing You and Prepayments as an Effective Interest Rate), here is the context: a few months ago, a borrower asked us, "Have we been making the correct financing decisions historically, or can we do better?" When the data was compiled, they found that they could have saved millions with some different financing decisions.
Now, we are out to empower those dedicated to constant improvement to take the same steps of evaluation, and we'll arrive at a "New Deal Checklist" that will contain all the questions you should be asking yourself before acquiring a new loan.

Fix vs Float and When You Should Consider Each
We recognize there are a lot of business factors that lead to choosing fixed vs floating: flexibility, proceeds, risk tolerance, supplementals, etc.
But setting business reasons aside momentarily, a simple examination of floating vs. fixed yields a conclusive fact...
Floating is almost always cheaper than fixed.
It's Always Cheaper to Float?
Not necessarily. Hey, if we could make any guarantees about the rate environment, our stock portfolios would be looking much better.
Many borrowers will use forward curves to help project interest rates over the life of a project, but it raises the question: how accurate is the forward curve?
The hairy graph (below) illustrates how accurately the market predicts LIBOR for the next five years at any given time, and it makes the word "accurately" look generous...
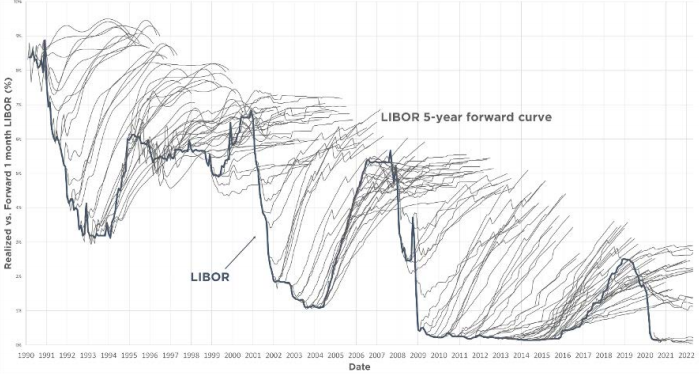
Key takeaways:
- In general, the market substantially overestimates the path of LIBOR
- When the market underestimates the path of LIBOR, it is usually during a tightening cycle
So, How Often Are Fixed Rates Better Than Floating Rates?
Let's look at a comparison of 3 month LIBOR vs. Treasury rates for five and ten year periods.
The gray Effective Rate line represents what the floating rate averages over the next five/ten years - if this line is above the blue Treasury line, you would have been better off locking in a fixed rate on that day. If the gray Effective Rate line is below the blue Treasury line, you would have been better off to float for that term.
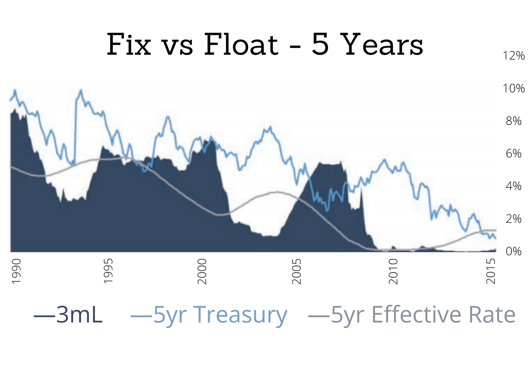 Over any rolling five year period of time, fixed rates are better than floating rates just 6% of the time.
Floating saved 4.80% annually on average.
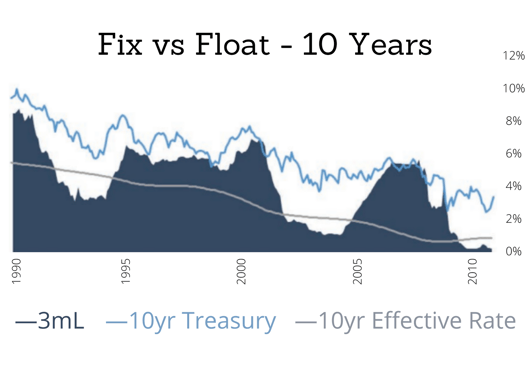
Over any rolling 10 year period of time, there has never been a time when fixed rates were cheaper than floating rates.
Choosing fixed has historically resulted in overpaying on interest expense by 4.70%.
Takeaways
- The market generally drastically overestimates the path of Fed Funds, explaining why the borrower that chooses to float typically saves money versus the fixed rate alternative. (Notably excepted is a tightening cycle, where the FOMC is hiking interest rates and the market underestimates the path of Fed Funds.)
- When choosing fixed ends up being wrong, it is wrong by a lot. When choosing floating ends up being wrong, it is wrong by just a little.
- The longer the term, the greater the likelihood of floating interest rates saving money relative to the fixed rate alternative.
Fix vs Float: Case Study
Let's use an example to quantify what choosing to float would have done over the hold period of a loan.
To do this, we'd start by downloading historical LIBOR, then we'd pull the LIBOR resets during the loan term.
Example: Let's say a $55.5mm loan was closed on 3/1/2013 at a 3.875% all-in interest rate. (The loan was prepayed after 35 months, the cost of which we break down in our previous two blogs!)
If Floating: If this loan were floating instead of fixed, the effective floating rate over that time period would have been 3.01%.
Overall: The 0.865% delta between fixing and floating translates into $480,075 of interest savings.
Across this borrower's portfolio, floating instead of fixing (on every loan) would have saved them $34.3mm in interest expense.
Pro tip - depending on your level of rate aversion, it might seem unreasonable to consider floating on a 10-year hold. But what if, instead, you consider floating on just those deals you ultimately hold for less than 3 years? At least some deals must be likely candidates for early disposition, right?
Download our New Deal Checklist here. Or download our eBook to learn more!
Stay in the loop for more and check out our blogs below!